By: Ray Day

CONTACT:

Ray Day
ray.day@stagwellglobal.com 

We wanted to share our latest consumer and business insights, based on research from The Harris Poll, a Stagwell agency.

Among the highlights of wave 140 (fielded Oct. 28-Oct. 30) in our weekly consumer sentiment tracking:

ECONOMY, INFLATION WORRIES MODERATE; JOB WORRIES JUMP:

Today, 86% of Americans are concerned about the economy, inflation and jobs – down 3 points from last week. At the same time, worries about losing a job jumped significantly.

    • 83% worry about a potential U.S. recession (down 2 points)
    • 82% about U.S. crime rates (no change)
    • 74% about political divisiveness (down 1 point)
    • 72% about the War on Ukraine (down 2 points)
    • 72% about affording their living expenses (no change)
    • 62% about a new COVID-19 variant (up 1 point)
    • 54% about losing their jobs (up 7 points)
    • 48% about the Monkeypox outbreak (up 4 points)
INFLATION AT THE NORTH POLE:

Eight in 10 (84%) Americans plan to buy gifts for others this holiday season, and they have set their 2022 gift-giving budget at $823, according to our survey with NerdWallet.

    • Close to a third (31%) of last year’s holiday shoppers are still in debt after using a credit card to pay for gifts they still haven’t paid off.
    • 72% of this year’s holiday shoppers will use credit cards, charging $663 on average.
    • Inflation is affecting how some shoppers approach gift-giving this year: 83% plan to adjust as a result of inflation, including giving different types of gifts compared to years past (36%) and spending less per person compared to years past (35%).
    • 43% say they feel pressure to spend more money on holiday gifts than they’re comfortable spending.
    • 68% plan to shop Black Friday/Cyber Monday sales this year.
    • 50% say they’ll spend the most on gifts while shopping these sales.
    • Still, 30% plan to use Black Friday/Cyber Monday sales to buy necessities for their home or family.
    • 67% say they will do their holiday shopping online instead of in-store this year.
OPEN ENROLLMENT BELT-TIGHTENING:

It’s healthcare open-enrollment season, and many workers are considering downgrading their health insurance because of high inflation, according to our survey with the Nationwide Retirement Institute.

    • 17% of respondents in the last 12 months adjusted their family’s budget to pay for health care expenses.
    • 12% canceled or changed health insurance.
    • 10% withdrew funds from their retirement account to pay for health care expenses.
    • 8% downgraded their health insurance plan.
    • 14% of Americans say they are considering downgrading their health insurance plan during this year’s open enrollment – rising to 23% for Gen Z and 20% for Millennials.
    • Americans also are experiencing high levels of stress around retirement and retirement planning because of inflation: 47% report their top stressor is inflation, 30% worry about Social Security running out of funds, and 29% are concerned about an unexpected decline in their health.
EMPLOYEES’ ADVICE TO HR: LESS IS MORE:

When it comes to HR tech platforms to improve the work experience, less is more, according to our survey with HR Brew.

    • On average, employees report using 3.4 HR platforms and 8.1 total HR and productivity tools in general.
    • 69% of employees with one HR platform said they felt confident they could find the information they need.
    • Confidence plummeted to 49% among those whose company has more than one HR platform.
    • In today’s economic climate, employees have an appetite for financial planning solutions (80% favorability among Millennials and 72% among Gen X) and the lowest need for new social networking tools.
INTEREST IN WOMEN’S SPORTS CLIMBING:

The popularity of women’s sports has grown by leaps and bounds – and consumers want to see the trend continue, according to Stagwell’s National Research Group’s new report, Leveling the Playing Field.

    • In the U.S., 3 in 10 sports fans say they’re watching more women’s sports now than they were five years ago.
    • The broadcast market for women’s sports grew significantly worldwide this year, thanks in part to successful events like the UEFA European Women’s Championship and ICC Women’s Cricket World Cup.
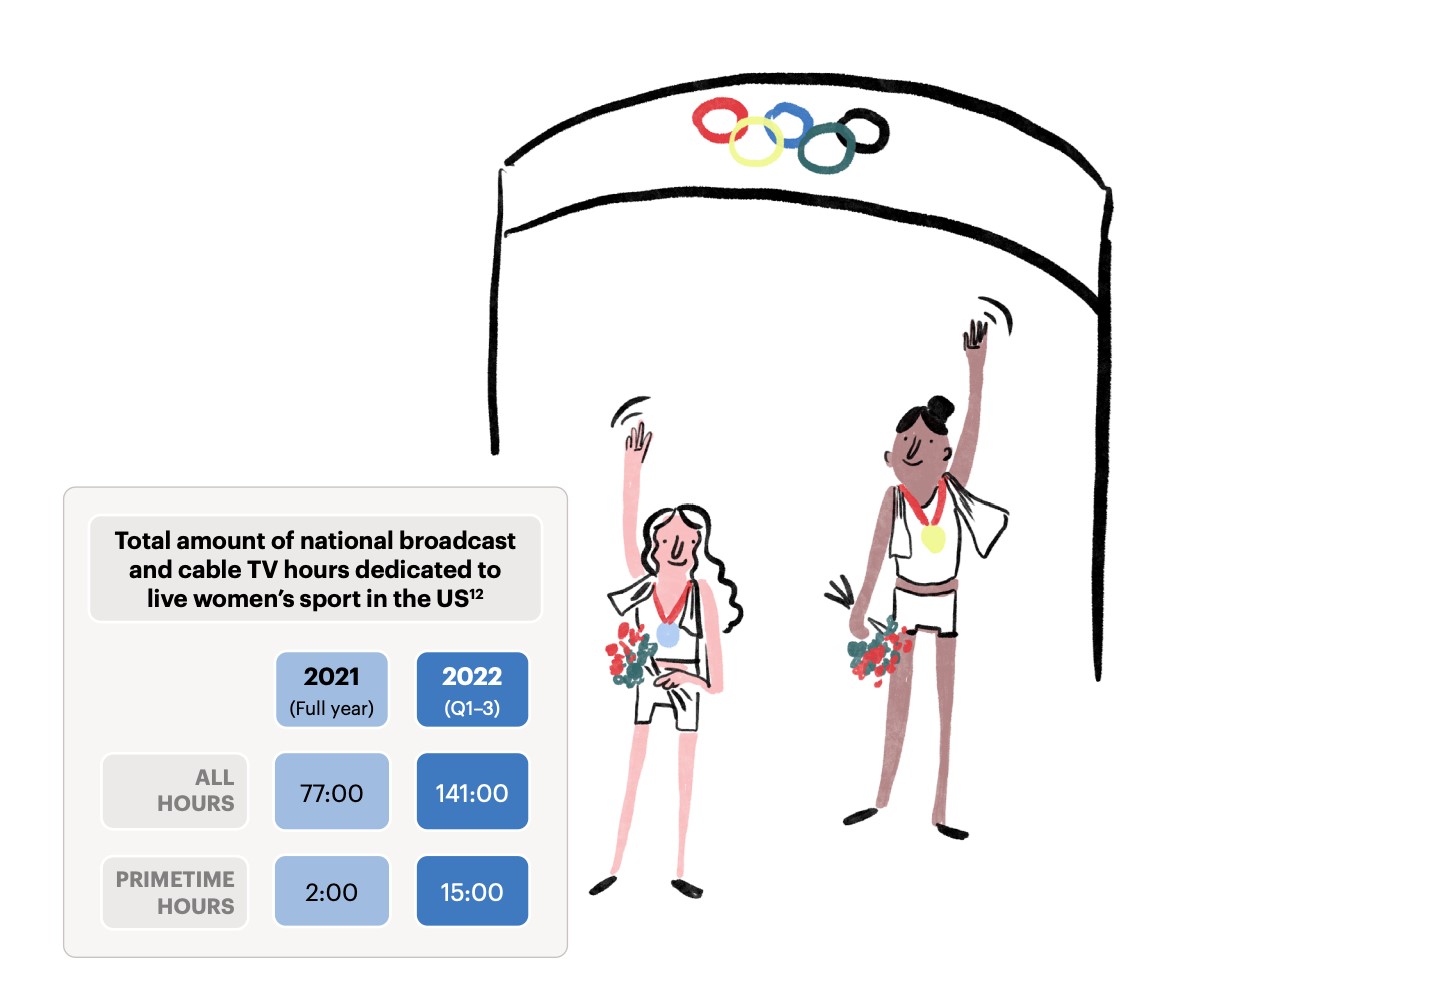
    • Even in the U.S., which didn’t compete in those tournaments, the market grew by 29% compared with 2021.
    • 85% of fans – including 79% of men – think that it’s important for women’s sports to continue to grow in popularity.
    • The Olympics proved there’s growing demand for women’s sports. During the Tokyo Games, in half of the 10 most widely viewed sports, viewership for women’s events was higher than men’s.
ICYMI:

In case you missed it, check out some of the thought-leadership and happenings around Stagwell making news:

As always, if helpful, we would be happy to provide more info on any of these data or insights. Please do not hesitate to reach out.


Related

Articles

Post Thumbnail
Post Thumbnail
Post Thumbnail

Newsletter

Sign Up

By: Ray Day

CONTACT:

Ray Day
ray.day@stagwellglobal.com 

We wanted to share our latest consumer and business insights, based on research from The Harris Poll, a Stagwell agency. 

Among the highlights of wave 139 (fielded Oct. 21-Oct. 23) in our weekly consumer sentiment tracking:

ECONOMY, INFLATION WORRIES REMAIN STEADY:

Today, 89% of Americans are concerned about the economy, inflation and jobs – the same high level as last week.

    • 85% worry about a potential U.S. recession (no change)
    • 82% about U.S. crime rates (down 1 point)
    • 75% about political divisiveness (up 1 point)
    • 74% about the War on Ukraine (no change)
    • 72% about affording their living expenses (down 1 point)
    • 61% about a new COVID-19 variant (up 1 point)
    • 47% about losing their jobs (no change)
    • 44% about the Monkeypox outbreak (down 4 points)
INFLATION IS AMERICA’S #1 STRESSOR:

How stressed are Americans, and what’s causing it? The answers are clear in the 2022 Stress in America survey we conducted with the American Psychological Association.

    • 27% of Americans report being so stressed that they cannot function most days.
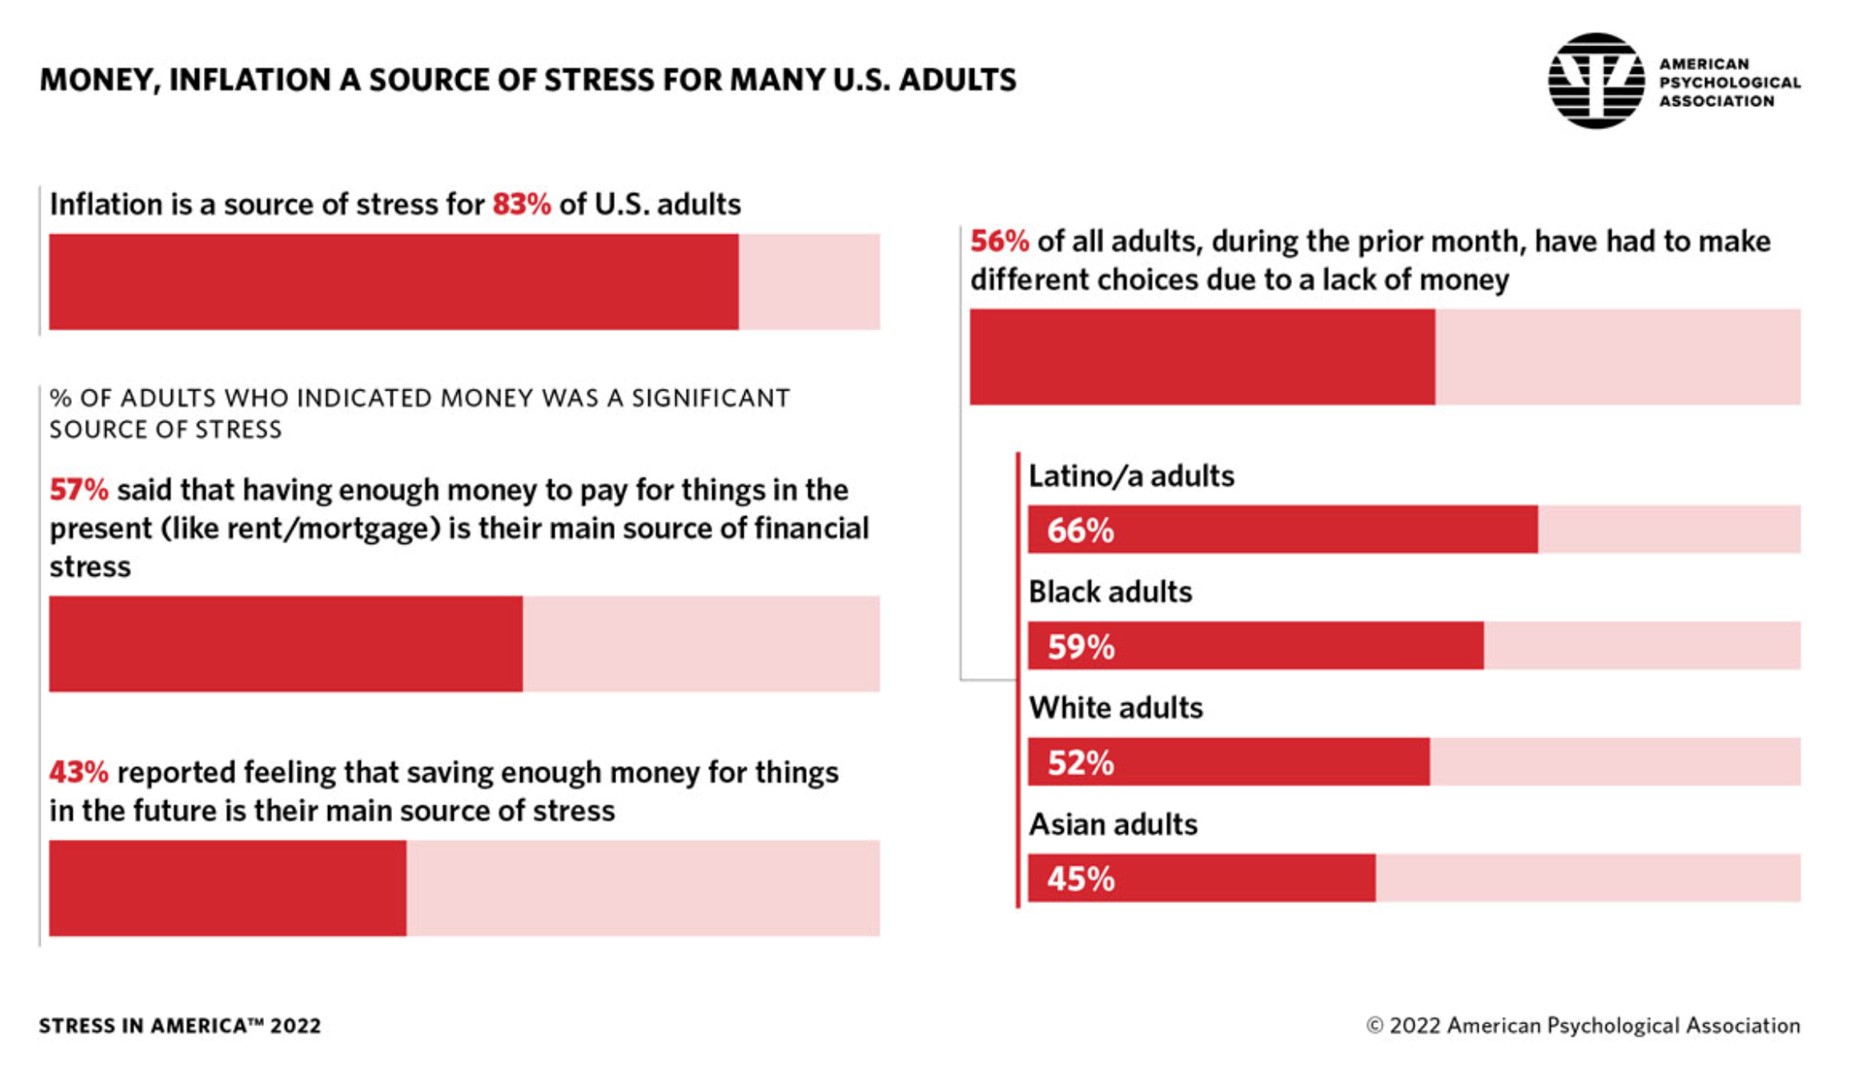
    • Inflation is the #1 stressor for 83% of adults. That is followed by violence and crime (75%), the current political climate (66%) and the racial climate (62%).
    • 76% say the future of the nation is a significant source of stress in their lives.
    • 68% say this is the lowest point in our nation’s history that they can remember.
    • 57% who indicated money was a worry said that having enough money to pay for things like food or rent/mortgage is their main source of stress.
    • 43% reported feeling that saving enough money for things in the future is their main source of stress.
    • 56% agreed that they and/or their family have had to make different choices due to lack of money in the past month, with Latino/a (66%) and Black Americans (59%) reporting this at a higher level than White (52%) and Asian (45%) American adults.
EMPLOYEES WARMING UP TO BACK-TO-OFFICE:

As we continue tracking return-to-office requirements, a majority of employees still say they will jump jobs if forced back to the office full-time. Yet the numbers of workers resisting return-to-office are much lower than three months ago, based on our survey with USA Today.

    • 57% of employed Americans say companies will lose employees if they require workers to be in-person (down 9 points from June).
    • 73% of remote and hybrid workers say they would find another remote or hybrid job if their company forced them to work from the office full-time (down 5 points from June).
    • In an earlier study with Bloomberg, 57% of workers said they believe that employers now have more power in the job market (a 5-point increase in favor of employers from January).
INFLUENCERS MATTER:

Nearly half of U.S. consumers consider input from influencers when purchasing a product or service – especially younger people, according to our survey with AdAge.

    • 80% of Gen Z consult user reviews before purchasing, and 75% say that recommendations from influencers affect their decision – nearly double the general population at 43%.
    • 40% of Gen Z members have made purchases directly through an influencer’s storefront on sites like Amazon and LTK.
    • 73% also report looking to TikTok creators for product input, with Instagram and YouTube influences being similarly popular choices.
BRANDS GETTING GEN Z RIGHT:

Beats by Dre, Jersey Mike’s Subs, Planned Parenthood, Lenovo and New Balance are doing the right things to capture the attention of Gen Z, according to the latest Ad Age-Harris Poll Gen Z brand tracker, a ranking of brands gaining the most attention from Gen Z members ages 18-24 in the third quarter.

    • Also doing better with Gen Z are Kickstarter, Impossible Foods, Coach, Flex Seal, Foot Locker, Pillsbury, Haagen-Dazs, Bose, Nature Valley, North Face, Crocs, NHL, Paramount, Fiji and State Farm.
    • See full details here.
ICYMI:

In case you missed it, check out some of the thought-leadership and happenings around Stagwell making news:

As always, if helpful, we would be happy to provide more info on any of these data or insights. Please do not hesitate to reach out.


Thank you.


Related

Articles

Post Thumbnail
Post Thumbnail
Post Thumbnail

Newsletter

Sign Up

By: Ray Day

CONTACT:

Ray Day
ray.day@stagwellglobal.com 

We wanted to share our latest consumer and business insights, based on research from The Harris Poll, a Stagwell agency. 

Among the highlights of wave 138 (fielded Oct. 14-Oct. 16) in our weekly consumer sentiment tracking:

ECONOMY, INFLATION WORRIES UP AGAIN:

Today, 89% of Americans are concerned about the economy, inflation and jobs – up 3 points from last week.

    • 85% worry about a potential U.S. recession (up 3 points)
    • 83% about U.S. crime rates (up 2 points)
    • 74% about political divisiveness (up 1 point)
    • 74% about the War on Ukraine (up 1 point)
    • 73% about affording their living expenses (no change)
    • 60% about a new COVID-19 variant (up 3 points)
    • 48% about the Monkeypox outbreak (up 1 point)
    • 47% about losing their jobs (down 1 point)
VOTERS SEE ECONOMY ON NOVEMBER BALLOT:

Mid-term elections are less than three weeks away, and inflation and the economy might be casting the deciding votes, according to our latest survey with Harvard’s Center for American Political Studies.

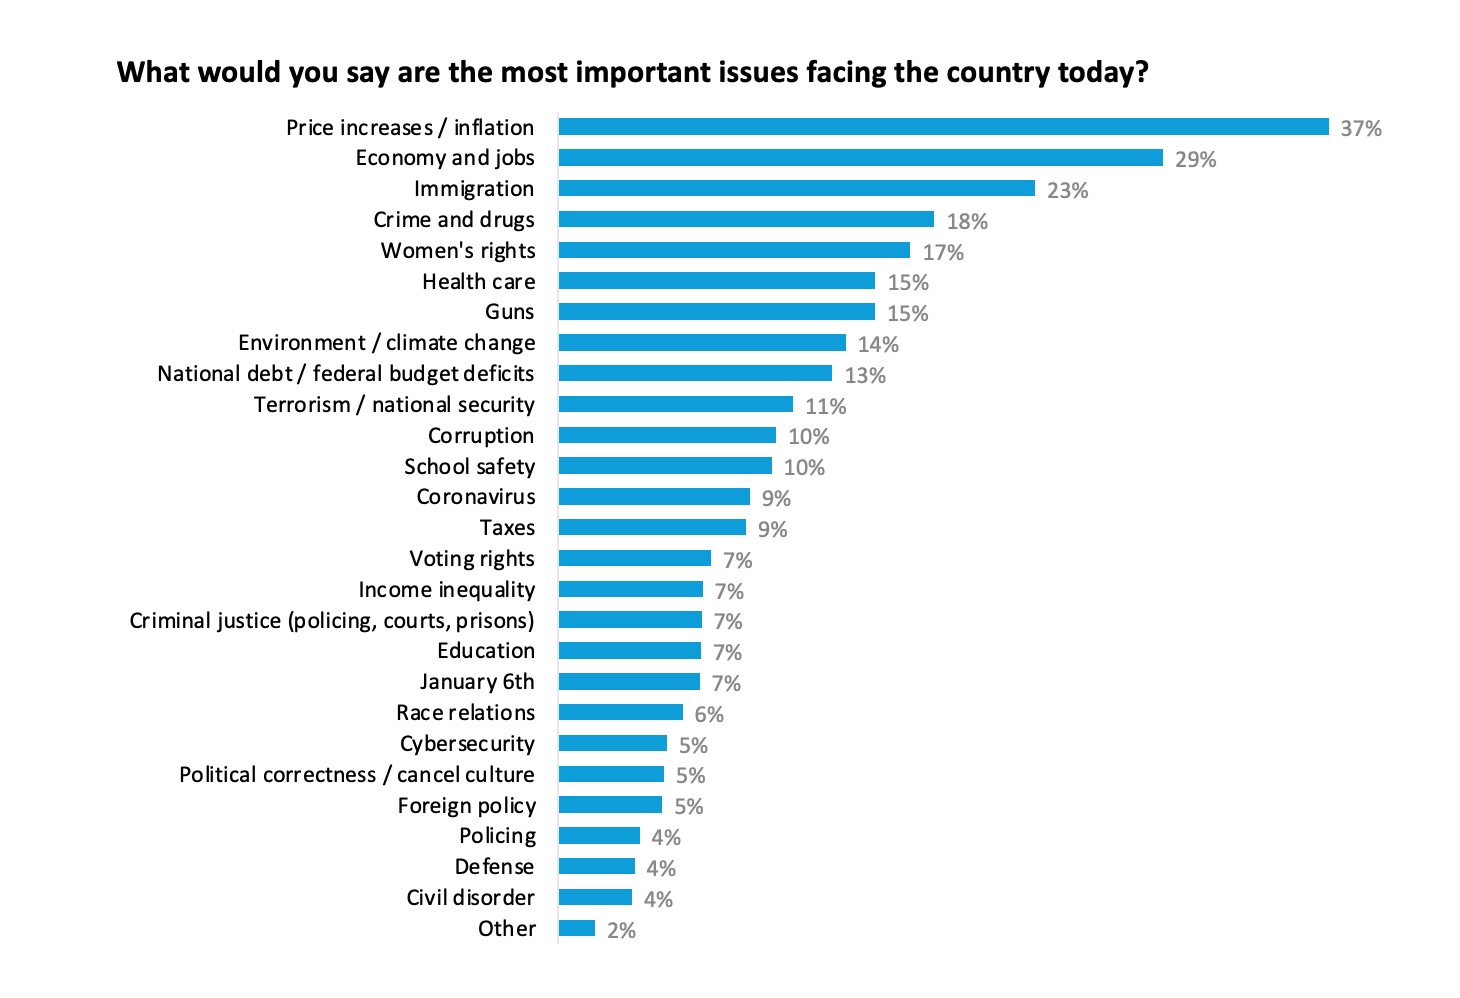
    • When asked to pick the most important issues facing the country today, voters identified inflation (37%), the economy and jobs (29%), immigration (23%) and crime (18%).
    • 73% believe inflation is increasing (versus 12% who say it is moderating and 14% who say it is staying the same).
    • 65% think the U.S. economy today is weak (versus 35% who say strong), and 57% say their financial situation is worse (up 20 points from a year ago).
    • 84% think the U.S. is in a recession now or will be in the next year.
    • 65% oppose easing sanctions on countries like Iran and Venezuela to lower gas and oil prices. Instead, they want greater output of American oil and gas.
    • 54% think the U.S. should cut military sales and technical aid to the Saudi Arabian government in response to its oil production cut.
NO KIDS = FREEDOM, MILLENNIALS SAY:

Americans are having fewer children than are needed to keep population numbers stable. Yet why are people choosing not to have children? In our survey:

    • Of those without children, 52% do not want to have a child in the future, while 20% remain unsure.
    • For those who have decided against having children, 54% want to maintain their personal independence/finances, 40% want work-life balance, 33% say it’s due to housing prices, 31% cite the current political situation, 31% say it’s because of safety concerns, and 28% cite climate change.
    • 55% of men and 53% of women reported that their desire to maintain independence influences their decision not to have children.
    • 65% agree that the freedom that comes with not having kids brings them happiness – increasing to 73% among Millennials, according to a similar survey with Fortune.
CREDIT SCORES IMMUNE FROM PANDEMIC:

The pandemic disrupted many Americans’ finances, yet that did not translate into lower credit scores, according to our survey with NerdWallet.

    • 27% of Americans say their credit score has gone up since the beginning of the COVID-19 pandemic, with just 14% saying it declined.
    • 69% with increasing credit scores attribute the gain to paying down debt.
    • For those who saw their scores drop, 47% attribute it to taking on or increasing debt.
    • 65% with higher credit scores took financial action as a result, such as applying for a rewards credit card (30%) or a mortgage/home equity line of credit (25%).
    • 61% of Americans plan to act during the next year to improve their credit scores, with half (49%) planning to pay off or pay down debt.
    • Still, credit misconceptions remain, with 46% of Americans incorrectly believing that closing a credit card you don’t use can help improve a credit score.
1 IN 4 ARE HALLOWEEN CANDY LOYALISTS:

With Halloween around the corner, our survey with Instacart has revealed consumers’ latest candy-buying habits.

    • 72% of Americans say they like Halloween.
    • 24% say Halloween is their favorite holiday.
    • 84% of people who buy Halloween candy will buy chocolate, while 56% will purchase fruity and chewy candy.
    • 23% of Americans are candy loyalists – with 65% buying the same Halloween candy for five or more years, and 40% buying the same types of Halloween candy for 10 or more years.
    • 63% of Americans report they now love a type of Halloween candy that they hated as a kid. Of those, 29% say they now love licorice, an 28% have developed an affinity for candy corn.
ICYMI:

In case you missed it, check out some of the thought-leadership and happenings around Stagwell making news:

As always, if helpful, we would be happy to provide more info on any of these data or insights. Please do not hesitate to reach out.


Thank you.

Related

Articles

Post Thumbnail
Post Thumbnail
Post Thumbnail

Newsletter

Sign Up

By
CONTACT

hello@stagwellglobal.com

SIGN UP FOR OUR INSIGHTS BLASTS

Twitter recently announced the launch of its new privacy policy with an innovative online game called “Twitter Data Dash,” conceived and directed by YML, and designed by Momo Pixel. The interactive, 8-bit style game was built to educate and engage Twitter’s global audience of 330M users around the importance of one’s privacy on the platform.

YML’s innovative approach has so far earned press from The Washington Post, The Verge, TechCrunch, Adweek, and an array of other publications.

“Few topics are as relevant today as privacy for both businesses and consumers alike, which is why we leapt at the opportunity to partner with Twitter and disrupt the category,” shared Ashish Toshniwal, YML’s CEO and co-founder.

When Twitter first reached out to us, Twitter’s Privacy and Design team was underway rethinking and rewriting their privacy policy so it presented itself to people as something other than a massive, relentless sledgehammer of text. They began by thoughtfully breaking it down. Structurally. Visually. Linguistically crafting in a way that no longer required you to acquire a Harvard law degree to understand.

Twitter brought in YML to deliver product innovation, and in less than three months, “Twitter Data Dash” was born, built, and launched.

“We quickly gravitated toward the idea of turning privacy — something people go out of their way to avoid — into something you’d be genuinely excited to look at, interact with, and share,” added Craig Kind, the YML Creative Director who led the project.

Formatted for mobile and browser, we spearheaded “Twitter Data Dash” from definition right through to final artwork, development and design. A feat that included both customizing in-game artwork and regionalizing the experience for 9 major languages.

The game itself brings the Twitterverse to life in 8-bit style. From a building in the form of a hashtag to a boat under water with a mast featuring the Twitter bird icon to stylized Internet trolls, we dove deep into the nuance and culture of Twitter and reflected it in “Twitter Data Dash.”

The game pays meticulous detail to accessibility, globalization, and characters with diverse backgrounds. That narrative was woven into the foundation of the game when we partnered with Momo Pixel, a visionary 8-bit artist, game developer, and designer whose work has already changed the industry, using the medium to comment on the black female experience in “Hair Nah”.

Momo Pixel, the artist who designed the game, shared, “Games are a great way to facilitate learning, so when Twitter and YML approached me with the opportunity to build a video game that can help make their privacy policy easier to understand, it was a no-brainer — I absolutely said yes!”

“Twitter Data Dash” is hosted on a website built by YML’s engineering team, which facilitated the technical architecture across YML, Twitter and Momo Pixel over the three month project. YML consistently ran usability and testing, QA, responded to daily changes of the experience, and ensured the experience was consistently fast and reliable across platforms.

Twitter’s business objective — our goal— was to design an experience that tackled a massive global problem in a way nobody ever had before. Launched less than a month ago, the game—and the subject of privacy—have been featured in countless major publications worldwide, and played by millions of people around the globe. Game over. Job done.

See more YML work here. Or get in touch to discuss your next project.


Related

Articles

Post Thumbnail
Post Thumbnail
Post Thumbnail

Newsletter

Sign Up

By

Yariv Drori,
Chief Strategy Officer, Multiview

CONTACT

hello@stagwellglobal.com

SIGN UP FOR OUR INSIGHTS BLASTS

The overwhelming concern and chatter about the demise of the 3rd party cookie is understandable because so much of our current data landscape relies on it. But, if we stop for a minute and regain perspective, it becomes evident that this change will ultimately be good for brands and their customers.  

MAKING HOT DOGS OUT OF PROBABILISTIC DATA

The amount of deterministic, high-quality data available in the marketplace, such as the self-declared information on your LinkedIn profile, has always been scarce and expensive. Demand for probabilistic 3rd party data, which assumes information about you based on articles you’ve read, was born in the shadow of that scarcity, and 3rd party cookies, that facilitate cross domain tracking offered cheap scale. Inevitably, the consequence of that scale was a compromise in quality, as algorithms generated an abundance of probabilistic data for marketers to act on. The problems started when speculative data became the go-to for campaign insights, usurping the higher-quality data that fuels better marketing.    

I like to use an analogy to the food industry. The amount of pricy solid-cut chicken and beef did not rise at the same rate as the total food available in the marketplace. To meet increasing demand, food processors found ways to turn 1kg of chicken breast into 5kg of “food” in the form of hotdogs, taco meat, and nuggets by mixing it with a cheap volume of corn, skin, gums, and sodium. Marketers have been making hotdogs by mixing strong, consented first-party data with high-volume (and affordable) probabilistic data, ultimately cheapening the effectiveness of their platforms.   

The internet, as we know it today, is a consequence of the value marketers put on targeting people based on speculative, processed data, with little regard to where the ads are displayed. The humble 3rd party cookie, which allows cross-domain tracking of people by hundreds of data aggregators, is the mechanism that enabled that cheap scale. Why pay $20 CPM on the New York Times when you can target people who have visited the NYT on some unknown site for a dollar? In other words – why pay $5 for a 1kg chicken breast when you can get 5kg of hotdogs for the same price?

WORKING WITH AUDIENCE SCARCITY  

As a B2B media company that helps thousands of businesses connect to their niche professional audiences, Multiview is well accustomed to dealing with audience scarcity. Finding the right people on quality media is the name of the game, but quality data that identifies professional audiences is scarce and expensive. Using data manipulation to create scale in B2B can easily result in a big waste of media dollars: algorithms designed to get scale can easily consider a person who’s searching for a ‘chair’ in the abundant broader category of ‘People in market for furniture’, which may sometimes be a legitimate tactic. However, that logic fails if a person is looking for something highly specialized, such as a ‘dentist chair’, for which the available data is very scarce. Challenging a scale algorithm to target people who search for ‘dentist chair’ could easily result in wasted media dollars spent on people who search for any piece of furniture or are looking for a dentist.

There is no doubt that the loss of 3rd party cookies creates the perception of loss of accuracy, scale, and transparency, but I would argue that what we are set to gain is more than what we are set to lose, because 3rd party data was never as good as the hype, just as processed food will never be better than a chicken breast.  

As a brand, the best data you have is the data you collect through direct relationships with people – think of it as raising your own chicken. The second-best option is to buy data and media directly from trusted publishers, like buying chickens from a local farmer you know by name.   

Knowing that, marketers should focus on three things as they prepare for the party after the cookiepocalypse:   

  1. GETTING CONTROL OVER 1ST PARTY DATA. Collect only what you need and do it consensually, while keeping it secure and current. Strike direct relationships with quality publishers that have direct relationships with their readers. 
  2. WEAN YOURSELF OFF THE THOUGHT DATA IS MORE IMPORTANT THAN PLACEMENT. And tighten your whitelist. Cheap scale is only for brands that have budgets to burn. It doesn’t matter how good your data is if you use it to buy an ad placement on an alarm clock app. 
  3. NREMEMBER THAT AT THE END OF THE DAY IT IS MORE ABOUT WHAT YOU SAY, THAN WHERE YOU SAY IT OR TO WHOM.  No data or savvy media strategy can supplant the great creative ideas needed to fuel modern marketing.

Life after the third-party cookie may be different, perhaps less convenient, and perhaps more expensive – but the detritus it will clear from the marketing stack will be better for clients and for internet users.

Related

Articles

Post Thumbnail
Post Thumbnail
Post Thumbnail

Newsletter

Sign Up

By

Farid (Freddy) Dabaghi,
SVP, Media, MMI Agency

CONTACT

hello@stagwellglobal.com

SIGN UP FOR OUR INSIGHTS BLASTS

Anyone in the world of digital advertising will doubtless have heard that Google last week announced the second delay in their plan to shut down third-party tracking cookies on their advertising platform, this time until late 2024. While consumers and regulators with internet privacy concerns might be justifiably displeased with the announcement, it is largely good news for marketing agencies and brands that advertise on the search giant.

Google – along with other big players – has been talking about a cookie-free web experience for some years, now, but they have delayed actually deprecating third-party cookies in Chrome, citing feedback from advertisers that have asked for more time to evaluate and test new tracking systems and solutions. Most notable in this arena is Google’s own “Privacy Sandbox,” an initiative launched in 2019 to explore and test alternatives to the cookie, which can track the apps that consumers use, the websites they browse and other personalized data.

A majority of advertisers have already had to plant one foot in this brave new world, as Apple began phasing out cookies in April 2021 with their “Ask not to Track” CTA, rolled out in IOS 14.5 and Safari. Google, however, given its ownership of Chrome and Android, is the biggest domino in the lineup.

While the newest delay offers some respite, advertisers are still wondering exactly what they need to do (if Google sticks to the latest timeline) once 2024 rolls around:

Make a Plan

In short, advertisers need to map out their “cookieless” plan, now, and stick to it, regardless of what future delays or other announcements may come. Key to these plans will be first party data, as leveraging this data for retargeting and seed audiences will drive more effective media tactics and should be prioritized. Brands, then, should continue to build out their first party data sets, whether they’re leveraged through eCRM/SMS programs, interactive website elements or deeper DMP integrations.

Creative is Key

Next, it will be critical to double down on breakthrough creative. As targeting abilities are eroded by the coming changes, creative will matter more than ever; make sure that it is engaging, compelling and drives a clear call to action. When possible, it will be particularly powerful to contextualize the creative to the source. For example, brands should leverage influencers & real people on social media and use high impact or rich media assets on programmatic advertising. It will be valuable, here, to take the opportunity to explore more organic options such as CRM & organic social to test creative before putting media dollars behind it.

Find Partners You Trust

Finally, brands should partner closely with their agencies & programmatic partners. Many partners are working on their own universal ID program to face the coming challenges. Given that the biggest player in the game is still testing what a cookieless world looks like, there is, as yet, no proven solution. Brands will be well advised, then, to evaluate options and tailor a solution that best serves their goals.

Related

Articles

Post Thumbnail
Post Thumbnail
Post Thumbnail

Newsletter

Sign Up

By

Jared Randall,
Web Analytics, GALE  

CONTACT

hello@stagwellglobal.com

SIGN UP FOR OUR INSIGHTS BLASTS

A comprehensive digital analytics strategy is vital to running a successful business today. The problem is — it’s not easy to get right. It’s complicated. But it doesn’t need to be. Here are four common problems and solutions to deal with them:

1. Your website or app doesn’t convert as well as you think it should.

You have built what you think is a good website or app after months of planning and development. You have put some marketing dollars behind it to increase acquisition, and you are seeing more people visiting your website or app than ever before. The problem is, they’re not converting as well as you think they should. New users are visiting and not buying your product, service, or signing up for your membership program.

Using tools like Google Optimize or Optimizely can let your users ‘vote’ between two or more options by how they use your website and permanently implement the options they like best. For example, your organization likes a white ‘Buy Now’ button, but your users buy more when the button is blue. You can now make that data-driven informed decision, and everybody wins! Improvement is an iterative process, and we help identify where the friction is and how to optimize those areas with your collaboration.

2. You can’t tell the difference between web and digital analytics.

It is important to understand the  difference between web and digital analytics and the importance of each source or platform in a digital strategy. A customer will interact with your brand through many different avenues; from email to search to social, each digital channel serves a purpose in interacting with your existing and prospective customers. Web and app also have their unique attributes and must be approached differently as well as holistically. 

A customer could interact with a company’s website and its app over their lifecycle, so why treat them as being two different user profiles? By using Google Analytics/Firebase Analytics you can integrate and build robust cross-device and cross-platform measurement plans for web and app platforms, helping to ensure strategies are customer-led.

3. You genuinely don’t know your customers.

Many businesses still don’t know the complete journey a customer takes once they visit their website or app before converting or what prevents a prospective user from converting. In terms of your business’s analytics maturity, you still might be stuck in the descriptive analytics phase and only able to answer questions like ‘What happened?’ but not why it did. It is important to be adaptive with your approach and understand the changing consumer landscape, as customers visit through a growing number of channels and don’t always take the path we want them to take.

With one of GALE’s ecommerce clients, we performed analyses to identify which key pages a customer visits on websites before they convert and where they fall out of the funnel to better understand how their customers interact with their platform. By understanding the most important pages to a user, we were able to set up a paid media strategy around driving users to these pages.

4. You don’t know what story to tell with your data.

You have tracking on your website or app, data is coming into your Google or Adobe Analytics console, and you begin reporting on some metrics you think are your KPIs. But there is no story, just a series of disjointed summary metrics. This could be for a few reasons: your implementation is filled with errors or incorrect data, you don’t know what these metrics say about your website, or you don’t have enough information to create a clear picture.

All data has a story to tell, but you need the right storyteller to extract it, interpret it, and communicate it effectively. It’s important to take time to understand the business, map out the critical interactions a user makes on your website or app, and create a robust plan to get the data you need to share it in a way that tells a story about your users.

Digital Analytics should be, and will continue to be, a part of your organization’s core decision-making tools. We’re continuing to reach further stages of Analytics Maturity as your ‘Good’ digital analytics strategy has become ‘Not Good Enough’ in a few short years. It’s time to be proactive and take control of your future.

Related

Articles

Post Thumbnail
Post Thumbnail
Post Thumbnail

Newsletter

Sign Up